Why Go Solar?
Understanding the Duck Curve and Why It Drives California Energy Costs
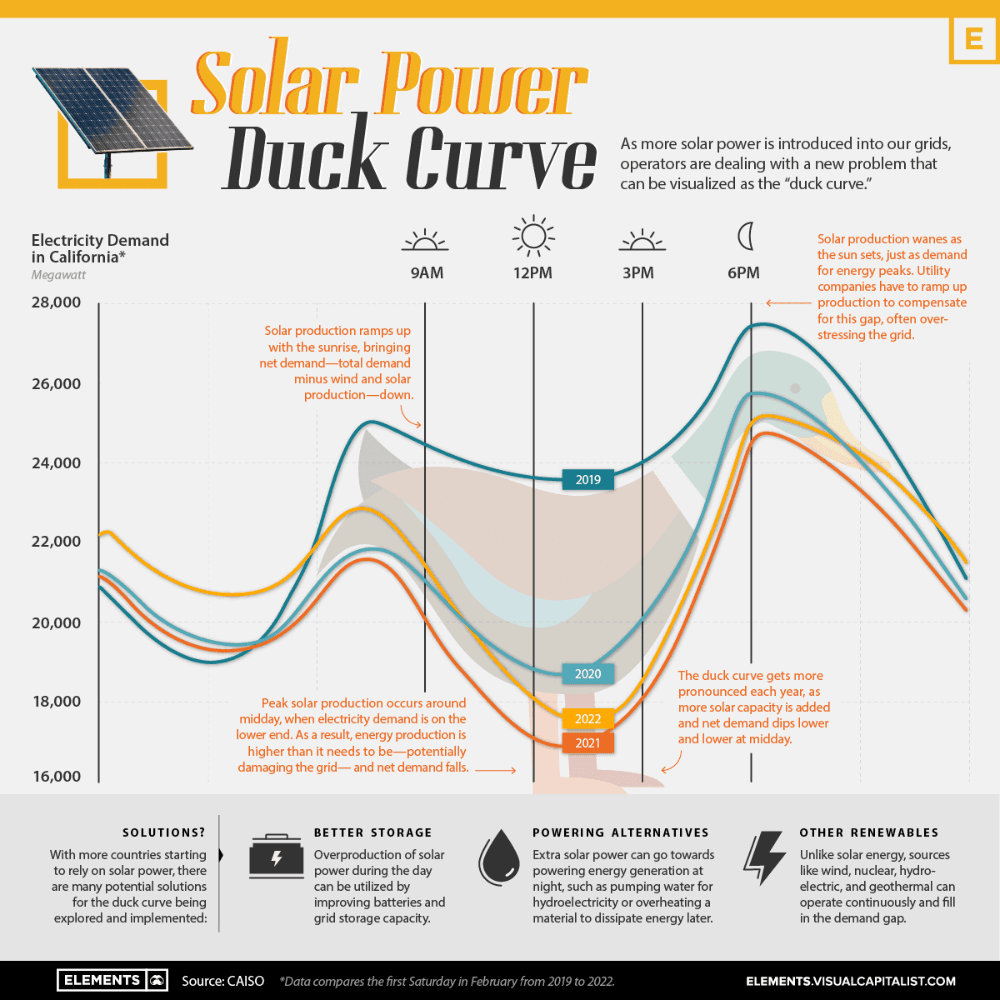
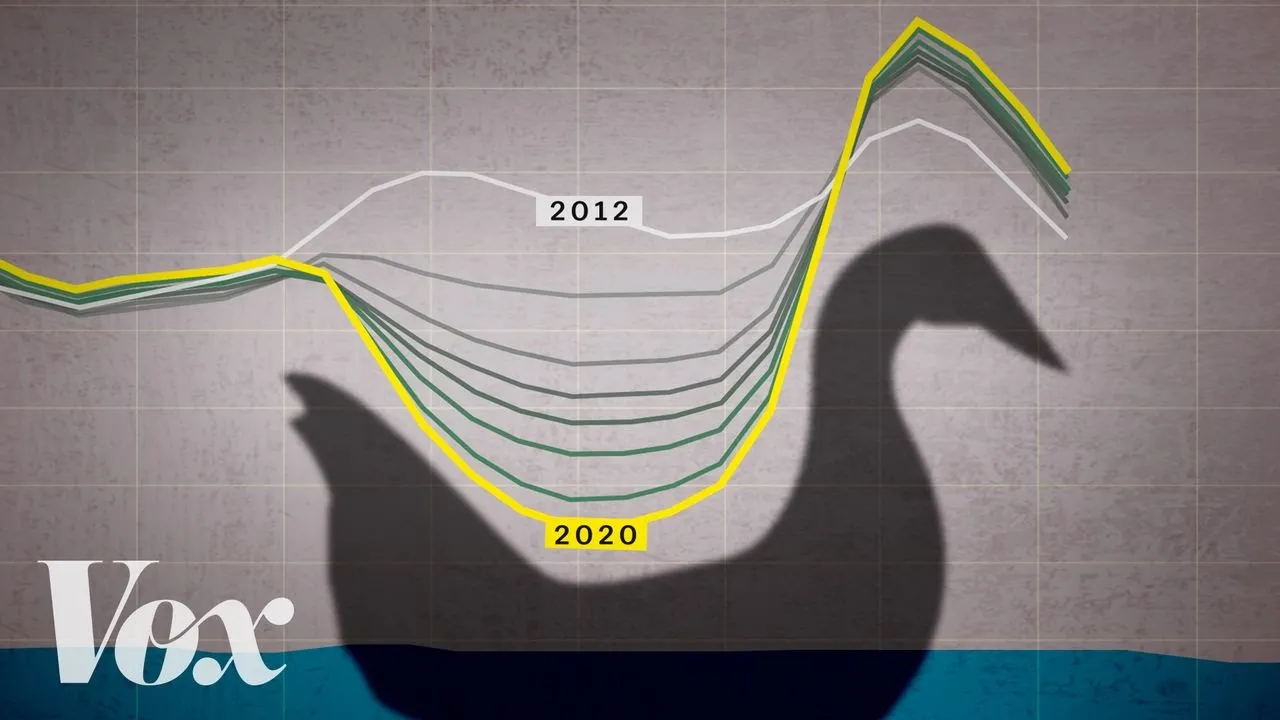
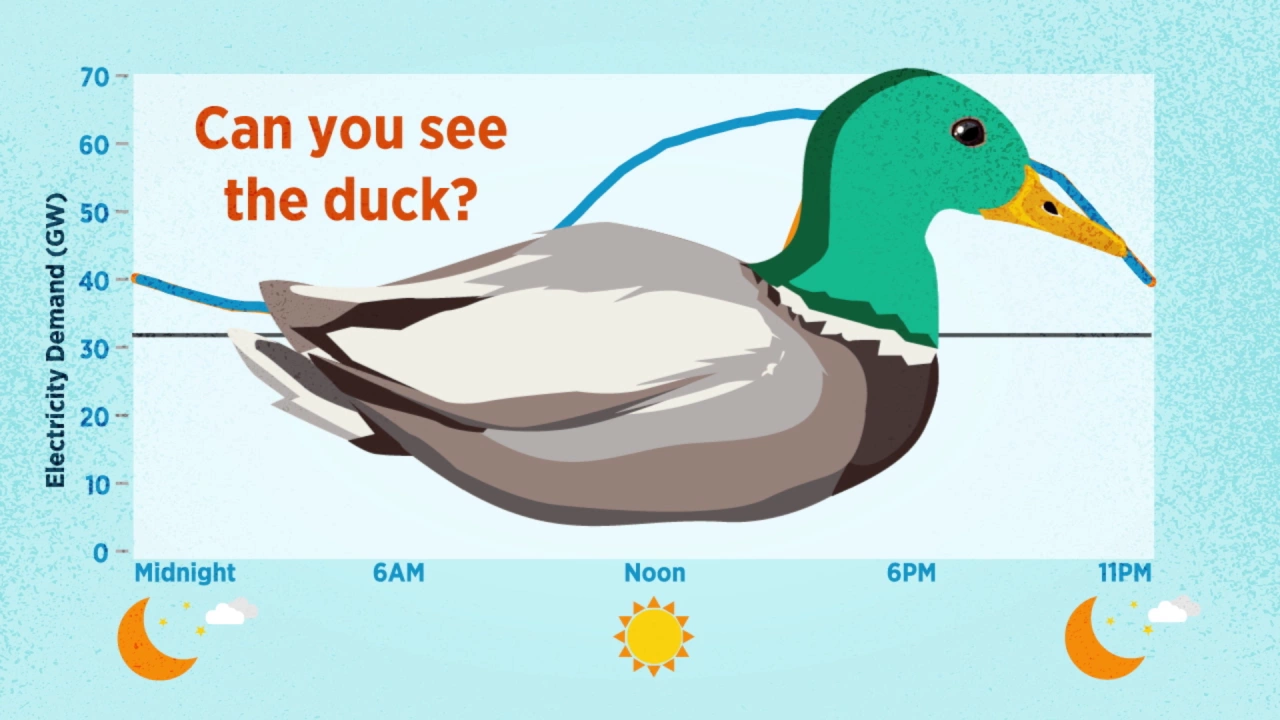
The "Duck Curve" refers to a chart that shows California’s solar energy supply peaking during midday — while electricity demand peaks in the early evening. As a result, the state often has more solar power than it needs during the day, but not enough energy when it’s needed most: after sunset.
This mismatch forces utilities to quickly ramp up fossil fuel-based energy production in the evening, which is expensive and carbon-intensive. This ramp-up curve — which looks like a duck in shape — makes electricity significantly more costly during peak hours (typically 4–9 PM).
Battery storage is key to solving this problem. By storing solar energy generated during the day, homeowners can reduce their dependence on expensive nighttime grid power. This not only lowers costs, but also reduces strain on the grid and cuts emissions.
Watch Vox's great explanation of the duck curve.
Here is the U.S. Department of Energy's attempt at it.
Sources:
https://www.caiso.com/Documents/FlexibleResourcesHelpRenewables_FastFacts.pdf
https://www.cnet.com/home/energy-and-utilities/the-duck-curve-what-is-it-and-is-it-a-problem/
Tags:
duck curve california, solar battery storage california, peak electricity prices, why is california electricity expensive, solar savings storage, duck curve explanation